
Generate Mermaid Diagram from your JSON data. How to Visualize JSON Data with Mermaid.js?
Convert JSON to Mermaid Diagrams & Flowcharts Instantly
Stop staring at thousands of lines of raw JSON. Our free JSON to Mermaid generator instantly transforms complex JSON objects into clear flowcharts, class diagrams, and graphs. Perfect for developers debugging API responses or documenting database schemas.
What This Tool Does
This is a free online converter that takes your JSON and turns it into diagrams. Not just any diagrams – we’re talking flowcharts, class diagrams, state diagrams, and more. Nine different types to be exact.
Think of it like Google Translate, but instead of converting languages, it converts JSON into visuals that actually make sense.
Why You’d Want This
Let’s say you’re working with an API response. You get back this massive JSON file with data nested five levels deep. Your options are:
- Scroll through it line by line (boring)
- Use a JSON prettifier (better, but still text)
- Convert it to a diagram (finally see what’s actually happening)
I built this because I was tired of drawing database schemas on whiteboards and then having to redo them every time the structure changed. Now I just paste the JSON and get a diagram in seconds.
The Nine Diagram Types (And When to Use Each One)
Tree Diagram – This is your go-to for most JSON structures. It shows parent-child relationships clearly. Perfect for config files or API responses.
Flowchart – Great when you want to see the flow of data through your system. I use this for understanding how different parts of an app communicate.
Class Diagram – Software developers will love this one. It shows your JSON as if it were classes in object-oriented programming. Helps when you’re planning out data models.
ER Diagram – Database folks, this one’s for you. Entity-relationship diagrams show how different data entities connect. Super useful before writing SQL schemas.
Sequence Diagram – Shows the order of operations. When you need to understand “what talks to what and when,” this is your friend.
State Diagram – Tracks different states in your data. Good for things like order statuses (pending, shipped, delivered) or user workflows.
Gantt Chart – Turns your JSON into a timeline. Not the most common use case, but handy if your JSON has date or sequence information.
Pie Chart – Visualizes numeric data distribution. If your JSON has numbers, this shows you proportions at a glance.
Mind Map – The creative option. Shows your JSON structure like a brainstorming session. Great for presentations.
Real-World Use Cases
For Developers: Paste that API response you’re trying to integrate. See the structure instantly. No more guessing which field is nested where.
For Database Admins: Take your NoSQL document and see it as a proper ER diagram. Makes migration planning so much easier.
For Technical Writers: Need to document an API? Generate diagrams for your documentation instead of trying to explain nested JSON in paragraphs.
For Students: Learning data structures? Upload example JSON and see it visualized. Way better than textbook descriptions.
For Project Managers: Someone on your dev team sends you a technical spec in JSON. Convert it to a flowchart and actually understand what they’re building.
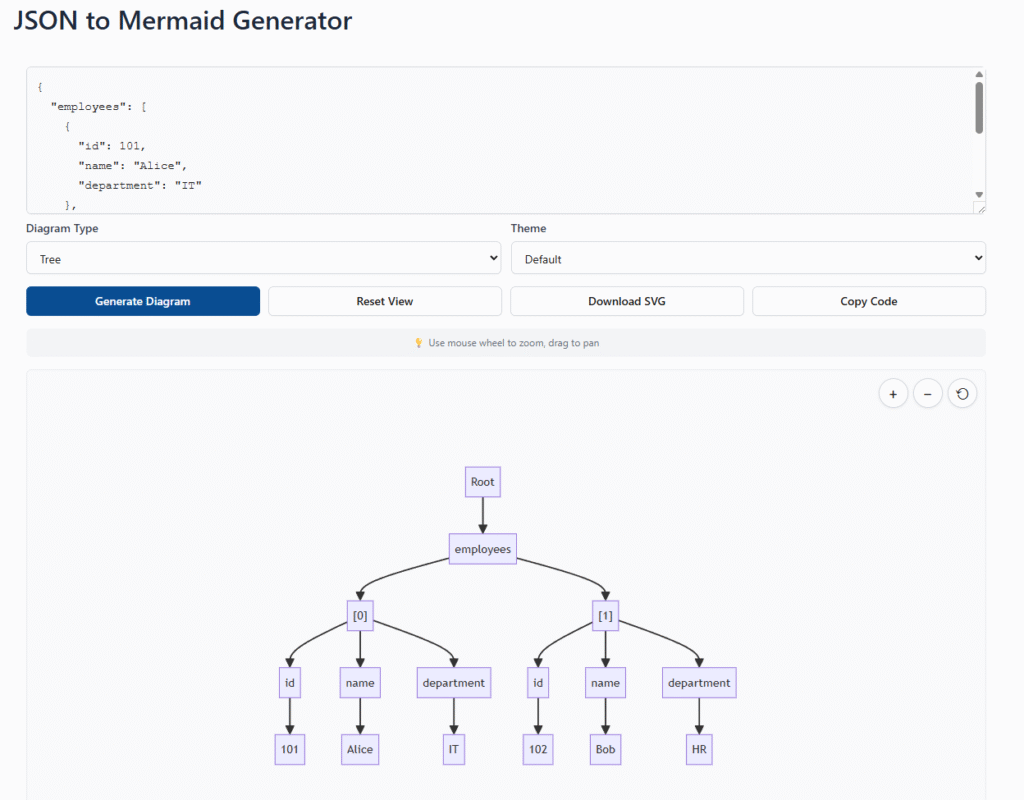
How to Use It
The interface is dead simple:
- Paste your JSON in the text box
- Pick a diagram type from the dropdown
- Hit “Generate Diagram”
- Download as SVG or copy the code
The tool checks your JSON as you go. If there’s a syntax error, it tells you right away. No need to debug in the browser console.
Mobile-Friendly Design
I made sure this works on phones and tablets. The whole thing is responsive. You can zoom with pinch gestures, pan around with your finger, and all the buttons are big enough to actually tap without cursing.
Why? Because sometimes you’re not at your desk. Maybe you’re in a meeting and someone asks “what does that data structure look like?” Pull out your phone, paste it, show them the diagram. Done.
Technical Details (For the Curious)
Under the hood, this uses Mermaid.js for rendering. It’s a popular diagramming tool that developers use in documentation. I built converters for each diagram type that parse your JSON and translate it into Mermaid syntax.
The whole thing runs in your browser. Your JSON never leaves your computer. No servers, no databases, no data collection. Just pure client-side processing.
The pan and zoom features are custom-built. I got tired of clunky diagram viewers that make you click tiny buttons. Now you just use your mouse wheel like you would with Google Maps.
WordPress Integration
If you run a WordPress site, you can embed this tool directly. Just drop the code into a Custom HTML block. It’s self-contained – all the CSS and JavaScript is inline, so it won’t conflict with your theme.
I’ve tested it with several popular WordPress themes. Works fine with Astra, GeneratePress, and the default Twenty Twenty-Four theme.
Common Questions
Does it handle large JSON files? Yes, but there are practical limits. If your JSON is megabytes large, the browser might slow down. For most real-world use cases (API responses, config files, etc.), it works great.
Can I customize the colors? The tool has four built-in themes. If you need more customization, you can edit the Mermaid code directly after generating.
What about arrays with hundreds of items? The tool is smart about this. For state diagrams, it only shows the first five array items to keep things readable. For class diagrams, it shows one item as an example of the structure.
Is there a limit on nesting depth? Most diagram types stop at 10-15 levels of nesting. If you have deeper structures, the outer levels still render fine.
If your JSON includes timestamps, make sure they’re formatted consistently. Refer to our strftime cheat sheet for Python date formatting standards.
Comparison With Other Tools
There are JSON viewers out there, sure. Most just prettify the text or let you collapse sections. That’s fine for small files but doesn’t help you understand the big picture.
There are also specialized diagramming tools like Lucidchart or Draw.io. Great products, but they’re manual. You have to draw everything yourself. This tool automates the whole process.
The closest alternative is probably writing Mermaid code by hand. But that’s exactly what this tool does for you automatically.
Privacy and Security
Since everything runs in your browser, your data stays private. I’m not collecting analytics, tracking users, or storing JSON on any server.
The only external resource loaded is the Mermaid.js library from their CDN. That’s it. No Google Analytics, no Facebook pixels, no hidden tracking.
Future Updates
I’m planning to add a few more diagram types. Block diagrams and timelines are high on the list. Also thinking about adding export to PNG (right now it’s SVG only).
If you have feature requests, let me know. This tool started because I needed it for my own work. I’m adding features based on what people actually use.
Getting Started
Head over to the tool and paste some JSON. Start with something simple – maybe a config file from one of your projects. See how it looks as a tree diagram.
Then try the same JSON with different diagram types. You’ll be surprised how different perspectives reveal different insights about your data structure.
The whole thing is free to use. No sign-up, no credit card, no trials. Just a tool that does one thing well.
Final Thoughts
JSON is great for computers but terrible for humans. We’re visual creatures. We understand pictures faster than we parse nested brackets.
This tool bridges that gap. It takes the data structure that works for machines and converts it into something that works for human brains.
Whether you’re debugging an API, planning a database, or just trying to understand someone else’s code, seeing your JSON as a diagram makes everything clearer.
Give it a shot. Paste some JSON and see what happens. I think you’ll find it useful.
Perfect for Global Documentation
Visualizing JSON data is essential for technical documentation. Whether you are a Solution Architect in the UK, a Frontend Lead in Canada, or a Backend Engineer in Australia, this tool instantly creates standard flowcharts that can be shared across international teams without language barriers.
FAQ
1. What is the JSON to Mermaid Generator used for?
This tool is designed to instantly visualize complex JSON data structures as diagrams. It parses your raw JSON code and converts it into Mermaid.js syntax (specifically for flowcharts or class diagrams). This is incredibly useful for developers who need to document API responses, understand data nesting, or explain database schemas to non-technical team members without drawing diagrams manually.
2. Is my JSON data processed securely?
Yes, absolutely. Toolshref prioritizes your privacy. This tool runs entirely client-side in your web browser. Your JSON data is never sent to our servers or stored in any database. You can safely paste sensitive configuration files or internal API responses here for visualization.
3. What happens if my JSON is invalid?
The tool includes a built-in validator. If you paste invalid JSON (e.g., missing commas, unclosed brackets), the generator will alert you to the syntax error so you can fix it before attempting to generate the diagram.
4. Can I edit the generated Mermaid diagram?
Yes! The tool provides the raw Mermaid code as output. You can copy this code and paste it into any Mermaid-supported editor (like the Mermaid Live Editor, Notion, GitHub, or Obsidian) to further customize colors, shapes, or layout directions.
5. How does this tool handle nested JSON objects?
The generator recursively traverses your JSON object. It represents nested objects as connected nodes in a flowchart. Parent keys point to child keys, creating a visual tree structure that makes it easy to spot relationships and hierarchy depths in your data.
6. Do I need to install Mermaid.js to use this?
No installation is required to generate the code. However, to render the output in your own projects, you will need a platform that supports Mermaid (like Markdown files on GitHub/GitLab) or the Mermaid.js library included in your website.
7. Is this tool free to use?
Yes, this JSON to Mermaid converter is 100% free and open for unlimited use. There are no daily limits on how many conversions you can perform.