
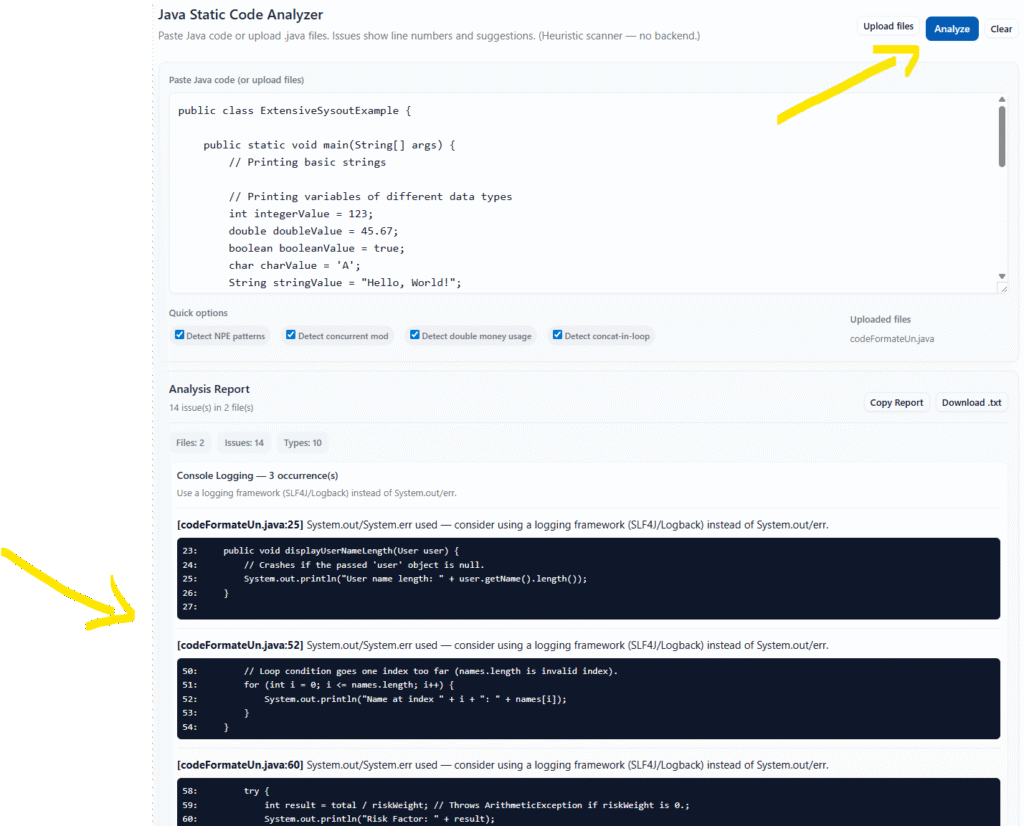
Java Static Code Analyzer
Paste Java code or upload .java files. Issues show line numbers and suggestions. (Heuristic scanner — no backend.)
Free Java Static Analyzer: Find Bugs in Your Code Instantly (No Installation Required)
If you’ve ever spent hours debugging Java code only to find a simple mistake like a missing semicolon or a null pointer exception waiting to happen, you know how frustrating it can be. That’s exactly why I built this free Java static analyzer tool that runs right in your browser.
What Is a Static Analyzer and Why Should You Care?
Static analysis means checking your code for problems without actually running it. Think of it like a grammar checker for your code – it spots issues before they become runtime nightmares.
The difference? You don’t need to compile anything, set up complex IDEs, or wait for your code to crash in production. Just paste your code or upload your Java files, hit analyze, and get instant feedback.
What Makes This Tool Different?
It’s stupidly simple to use. No installation, no configuration files, no wrestling with plugins. Open it in your browser and you’re done.
It actually works offline. Once the page loads, everything runs on your machine. Your code never leaves your browser, which means your proprietary code stays private.
It shows you exactly where the problem is. Each issue comes with the line number, a snippet of the surrounding code, and a clear explanation of what’s wrong and how to fix it.
Features That Actually Matter
Multiple File Support
Upload as many .java files as you need. The tool processes them all and gives you a consolidated report. Perfect for checking entire packages or modules at once.
Smart Comment Handling
The analyzer ignores single-line comments, inline comments, and multi-line block comments. It won’t flag issues in commented-out code, which is something that trips up a lot of basic checkers.
Configurable Detection Options
Turn specific checks on or off based on what you need:
- NPE Detection: Catches potential NullPointerExceptions before they happen
- Concurrency Issues: Spots when you’re modifying collections during iteration
- Money Handling: Flags when you use double for monetary values (you should use BigDecimal)
- String Operations: Detects inefficient string concatenation in loops
15+ Bug Patterns Detected
Here’s what the tool catches:
Common Syntax Errors:
- Missing semicolons
- Unmatched brackets, braces, and parentheses
Runtime Exceptions Waiting to Happen:
- Null pointer exceptions from calling methods without null checks
- Division by zero (both literal zeros and unchecked variables)
- Array index out of bounds from off-by-one errors in loops
Bad Practices:
- Using
==to compare strings instead of.equals() - Empty catch blocks that swallow exceptions
- Resource leaks from not using try-with-resources
- Raw generic types without type parameters
Performance Issues:
- String concatenation inside loops (use StringBuilder instead)
- Console logging with System.out instead of proper logging frameworks
Precision Problems:
- Double variables used for monetary values
- Arithmetic operations on money-related variables
Export Your Results
Get your analysis report in multiple formats:
- Copy to clipboard for quick sharing
- Download as a text file for documentation
- View in a clean, organized interface with collapsible sections
How to Use It (It Takes 30 Seconds)
Option 1: Paste Your Code
- Copy your Java code
- Paste it into the text area
- Click “Analyze”
- Review the issues
Option 2: Upload Files
- Click “Upload files”
- Select one or more
.javafiles - Click “Analyze”
- Get results for all files at once
That’s it. No registration, no download, no setup.
Real-World Use Cases
Before Committing Code Run a quick check before pushing to your repository. Catch embarrassing mistakes before your teammates see them in code review.
Learning Java If you’re new to Java, this tool helps you understand common mistakes. The suggestions tell you not just what’s wrong, but why it matters and how to fix it.
Code Reviews Use it as a first pass before doing manual code reviews. Let the tool catch the obvious stuff so you can focus on logic and architecture.
Legacy Code Cleanup Working with old code that doesn’t have proper error handling? Run it through the analyzer to spot low-hanging fruit for improvements.
Teaching and Tutoring If you teach Java, this is a great way to show students common mistakes. The visual feedback helps them understand what to avoid.
Understanding Your Results
The tool groups issues by type and shows you:
- File name and line number where the issue occurs
- Issue type (like “Possible NullPointerException” or “Empty Catch Block”)
- Explanation of what’s wrong
- Suggestion for how to fix it
- Code snippet showing the problem in context with surrounding lines
Each issue type comes with a summary count so you can prioritize what to fix first.
Limitations (Being Honest Here)
This tool uses pattern matching and heuristics, not full AST (Abstract Syntax Tree) parsing. That means:
It might miss some issues that a full compiler-based analyzer would catch. Complex control flow or deeply nested code can sometimes slip through.
It might flag false positives in certain edge cases. For example, if you have a legitimate reason to use == for string comparison in a specific context, the tool will still flag it.
It’s not a replacement for tools like SonarQube, SpotBugs, or PMD if you need enterprise-level analysis. But it’s way faster and easier for quick checks.
Think of it as your first line of defense, not your only one.
Frequently Asked Questions
Q: Is my code secure? Do you store it anywhere? A: Your code never leaves your browser. Everything runs locally on your machine. There’s no server, no database, no backend at all. Once you close the tab, your code is gone.
Q: What Java versions does it support? A: The tool works with all Java versions because it’s pattern-based, not compiler-based. Whether you’re using Java 8 or Java 17+, it’ll check your code.
Q: Can I use this for commercial projects? A: Yes, absolutely. There are no restrictions. It’s free to use for any purpose.
Q: Why does it flag things that aren’t actually errors in my code? A: Static analysis tools use heuristics, which means they make educated guesses. Sometimes they’re overly cautious. If you’re sure your code is correct, you can safely ignore those warnings.
Q: Can it fix the issues automatically? A: No, it only detects and reports issues. You’ll need to fix them manually. This is intentional – automated fixes can sometimes make things worse if the context isn’t fully understood.
Q: Does it work offline? A: Yes! Once the page loads, you can disconnect from the internet and it’ll still work. All processing happens in your browser.
Q: How accurate is the line number reporting? A: Very accurate for direct issues. The line numbers point to exactly where the tool detected the pattern. For multi-line issues, it points to the starting line.
Q: Can I integrate this into my build process? A: Not directly since it’s a browser-based tool. But you can use the HTML file locally or adapt the code for your needs. The source is right there in the page.
Q: What browsers does it support? A: All modern browsers – Chrome, Firefox, Safari, Edge. As long as your browser supports ES6 JavaScript, you’re good to go.
Q: How big of a file can I analyze? A: There’s no hard limit, but extremely large files (10,000+ lines) might slow down your browser. For best performance, analyze files in reasonable chunks.
Q: Can it check Spring Boot or Android code? A: Yes, it checks plain Java syntax patterns. Whether your code is for Spring, Android, JavaFX, or anything else doesn’t matter.
Q: Why doesn’t it catch [specific issue]? A: The tool focuses on common, high-impact issues. Adding every possible check would make it slower and harder to use. If there’s a specific pattern you need checked regularly, you might want to look at more comprehensive tools.
Q: Is there a way to customize the rules? A: Currently, you can toggle the four main detection categories on and off. Full rule customization would require modifying the source code.
Q: Can I contribute to make it better? A: The tool is provided as-is, but you’re welcome to take the code and modify it for your needs. It’s just HTML and JavaScript, so it’s easy to extend.
Tips for Getting the Most Out of It
Start with all checks enabled. You can always turn them off later if you get too many false positives for your use case.
Fix issues top to bottom. Some bugs cascade – fixing an early issue might resolve later ones automatically.
Don’t ignore patterns. If the tool keeps flagging the same type of issue in your code, that’s a sign you have a systemic problem worth addressing.
Use it early and often. The earlier you catch bugs, the cheaper they are to fix. Run it before every commit.
Read the suggestions. They’re not just generic advice – they explain why each issue matters and what better alternatives exist.
The Bottom Line
This isn’t going to replace professional-grade static analysis tools if you’re working on critical systems. But for everyday development, learning, or quick checks? It’s fast, free, and actually useful.
No account needed. No installation required. No BS.
Just paste your code and see what’s wrong. Sometimes the simplest tools are the best ones.
Ready to try it? Load up the tool and throw some code at it. You might be surprised what it finds.
Got feedback? If you run into issues or have suggestions for improvement, I’d love to hear them. The tool is straightforward by design, but there’s always room to make it better.